

IndexBox
Data AnalysisUpdated October 26, 2026
Market intelligence platform with machine-learning forecasts and trade, production and price data for 10,000+ products in 200 countries.
We may earn a commission when you sign up through our links. It does not affect our reviews.
What is IndexBox?
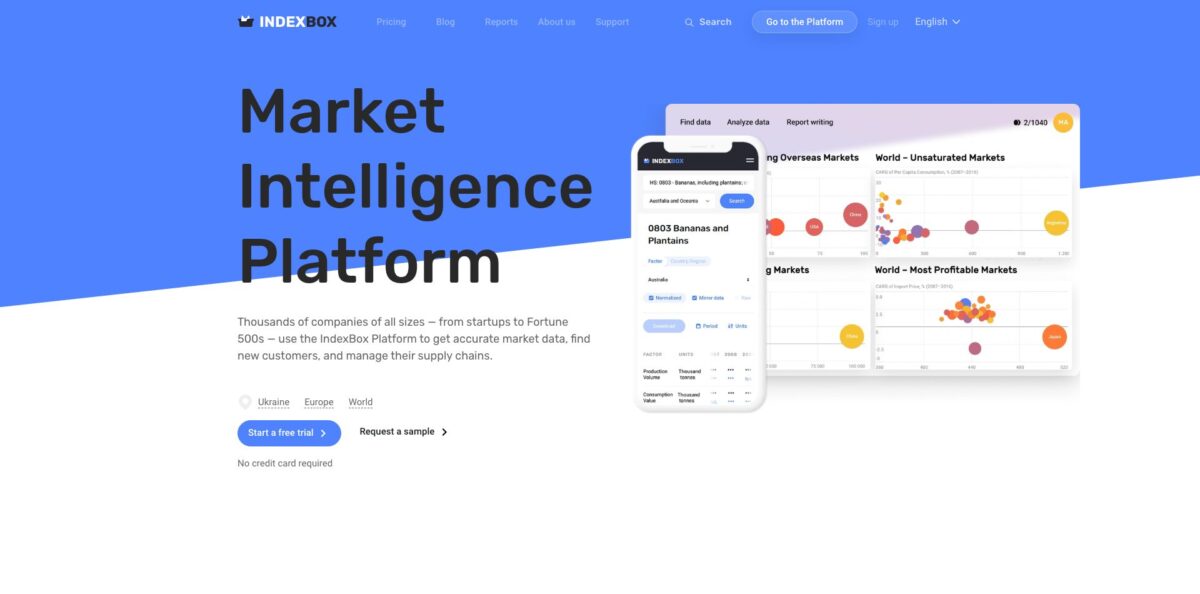
Think of it as a cleaned-up, forecast-ready layer on top of official trade and production statistics. IndexBox collects figures from more than 100 sources it checks daily, then uses what it describes as AI-driven algorithms and machine-learning models to cross-check the numbers, restore missing data and estimate indicators that official sources never publish. The result is consumption, production, imports, exports and prices for over 10,000 products in about 200 countries, coded by HS classification, with history from 2007 and a medium-term forecast. You read it as tables, dashboards or auto-written report text, or pull it through an API. The weak spot is cost: subscriptions run to thousands of dollars a year, and price is the top complaint on G2. Pick it if you size markets or screen export destinations regularly, not if you want a chat assistant that analyzes your own files.
How to start using IndexBox?
Click Start a free trial on the homepage; no credit card is required, and sign-up on app.indexbox.io is a two-step form. Once inside, the top menu splits the platform into Table, Dashboard, Report, Companies, Brands and Indicators. IndexBox does not publish the exact limits of the trial, so treat it as a chance to learn the interface and check coverage for your products before you commit to a paid plan.
Your first real scenario should be a market you already know. On the Find Market Data screen, pick a product and a region. You can search by product name or by HS code, and the product list also shows PRODCOM and NAICS codes where they apply. Products follow six-digit HS 2007 codes, with some broader four-digit groups, so “poultry” sits under HS 0207 while turkey cuts have their own code. Choosing the right level of detail up front saves you from comparing mismatched categories later.
The screens that matter most are the three views of the same dataset. Table gives you the raw indicators, including consumption, production, imports, exports, prices and trade partners. Dashboard covers the Analyze Data side: a global market map by region or country, trend charts, rankings and share breakdowns. Report holds prepared text descriptions of each indicator’s trend and a basic finished report you can download and extend. The methodology page explains how each indicator is calculated, for example consumption equals production plus imports minus exports.
Before you put a number in a deck, check where it came from. The platform shows data sources and how the data was processed, and paid plans include tracking of sources and predictive models. Downloads come as .xlsx tables, .pptx dashboards and .docx reports, either within your plan’s monthly allowance or for credits. If you plan to feed the data into your own systems, generate an API key in your personal account and pass it with each request.
Who is it for?
Export managers
Choosing the next target country usually means stitching together customs tables from several statistics offices. IndexBox puts import volumes, prices and supplier countries for one product side by side, so you can shortlist markets without building the comparison by hand.
Market research consultants
Proposals and due-diligence notes need a defensible market size fast. The consumption, production and trade figures, plus a downloadable report draft, give you a quantified starting point that your own interviews and analysis can then refine.
Procurement and supply chain teams
When a supplier country becomes risky, you need to know who else exports the same product and at what price. Export prices by country and trade partner data help you spot alternative sources and sanity-check quotes.
Corporate strategy and finance analysts
Investment memos often lean on a single market estimate with unclear origins. IndexBox’s medium-term forecasts and source tracking give you a second, traceable number to test assumptions against.
Data and BI teams
Manually downloading spreadsheets every month does not scale. The API, Snowflake secure views, Databricks Delta tables and BigQuery workflows let you load market data into the same pipelines and dashboards your company already uses.
Students and academic researchers
Free blog stories and market insight pages cover many products, which helps with coursework. Full datasets sit behind subscriptions that reviewers describe as hard to justify for individuals, so plan around the trial and public pages.
IndexBox pricing
IndexBox sells a Premium Subscription in four tiers, priced in US dollars per month, with 30% off when you pay annually in one upfront payment. Every plan includes online access to tables, dashboards, reports and company data; the tiers differ in product coverage, free downloads, users, API calls and lead data. Extra downloads cost credits at $2 each, with a minimum purchase of 50 credits for $100. A table costs 20 credits, a dashboard 50 and a report 70, so an extra .docx report works out to $140. Credits last 365 days but can only be used with an active subscription. Taxes may apply at checkout, plans auto-renew, and all payments are non-refundable.
Marked as a limited-time offer. One user gets online access to data for one selected product per month across all countries. Downloads are credit-only, company leads cost 1 credit each, there is no API, and you get 1 Brands keyword per month.
Full online access to all 10,000+ products for one user, including source and model tracking. Downloads and company leads are still paid in credits, there is no API, and Brands allows 10 keywords per month.
Labeled most popular. Adds 30 free downloads per month (10 tables, 10 dashboards, 10 reports), API access up to 10,000 calls per month, 100 company leads per month, 30 Brands keywords and online training sessions.
Three users share 90 free downloads per month (30 of each format), up to 100,000 API calls per month, 300 company leads per month and 90 Brands keywords.
Custom research by IndexBox analysts is quote-based through the contact form.
IndexBox key features
Cross-checked official statistics
IndexBox pulls data from more than 100 sources it checks daily and runs algorithms that compare several sources against each other, restore missing statistics and estimate indexes that official sources do not provide. That fills the gaps you hit when a country stops reporting a product.
Machine-learning forecasts
The company says its models train on billions of data points to forecast market growth, demand and prices over the medium term. Forecasts sit next to historical data from 2007, so you can see the trend line and the projection in the same view. Paid plans let you track the predictive models behind each forecast.
Broad product and country coverage
The platform covers more than 10,000 products classified by HS code across 200 countries split by region, with trade partner data and monthly updates. IndexBox counts 6 billion datasets refreshed each month. You can compare a niche chemical and a staple crop with the same set of indicators.
Tables, dashboards and report text
Each dataset is available as a table, a visual dashboard with maps, rankings and shares, and a report with prepared text describing trends. Downloads export to .xlsx, .pptx and .docx, which cuts the time between finding a number and putting it in front of a client.
Companies and Brands data
The Companies section offers lead data on businesses, sold at 1 credit per company on lower plans and bundled at 100 or 300 per month on higher ones. Brands runs custom keyword searches, capped from 1 to 90 keywords a month by plan. Sales teams can move from market sizing to a prospect list without changing tools.
API and data platform integrations
A REST API, also listed on RapidAPI, returns trade, production and price indicators with an account-level key and request limits. IndexBox also documents Snowflake secure views, Databricks Delta tables, Google Cloud BigQuery and Cloud Storage exports, AWS Marketplace billing and Zapier webhooks. Your BI dashboards can refresh from the same data your analysts browse.
IndexBox Pros & Cons
Pros
G2 reviewers rate IndexBox around 4.5 out of 5 and keep returning to two points: the data is easy to reach and the coverage is wide. You get consumption, production, trade and price figures for thousands of products in one place, with history from 2007 and forecasts, instead of chasing separate customs and statistics portals. Gaps in official data are estimated rather than left blank, and the platform shows where each figure came from. Export to Excel, PowerPoint and Word shortens the path to a client deliverable, and the API plus Snowflake and Databricks options suit data teams. Start with the products you track most often and build a reusable dashboard export before expanding to new markets.
Cons
Price is the most common complaint. Full access starts at $350 a month on annual billing, downloads beyond your allowance cost credits, and payments are non-refundable, which reviewers say puts it out of reach for students, individual researchers and small firms. Some users also mention that many datasets that once felt free now require payment, that certain analyses lack depth, and that the sources and statistical adjustments are not always clear. Data updates monthly from official releases, so it is not a real-time feed. The AI works behind the scenes on cleaning and forecasting, and the official pages describe no chat interface for querying data or your own files. Use the trial and a sample report to check depth for your exact products before paying.
Use IndexBox if you want…
- Size product markets by country in minutes.
- Compare import and export prices across supplier countries.
- Shortlist new export markets using official trade data.
- Get medium-term demand and price forecasts per product.
- Export market dashboards straight into PowerPoint decks.
- Fill gaps in national statistics with estimated values.
- Pipe global trade indicators into Snowflake or Databricks.
- Pull company lead data alongside your market research.
IndexBox alternatives
IndexBox Reviews
G2 reviewers praise how quickly they can find industry data, production statistics and market trends in one platform, but the most frequent complaint is that the subscription feels expensive for the level of insight provided.
A student on G2 found it convenient to access global market data and statistics in one place, while wishing more of the statistical datasets were free instead of locked behind payment.
Users value the accuracy and broad coverage when assessing market size and trade flows, though some say detailed data and full reports are mostly restricted to paid plans and certain analyses lack depth.
Several reviewers call the interface easy to use overall, yet others find it overwhelming at first and want clearer explanations of the data sources and calculations behind the estimates.
FAQ
Is there a free plan or free trial?
There is a free trial with no credit card required, and blog stories and market insight pages are free to read. IndexBox does not publish the exact trial limits, and full datasets require a paid subscription.
Where does IndexBox use AI?
IndexBox describes AI-driven algorithms that cross-check data from multiple sources, restore missing statistics and estimate indicators, plus machine-learning models that forecast market growth, demand and prices. Its official pages do not describe a chat assistant for asking questions in plain language.
How often is the data updated?
IndexBox says it checks more than 100 sources daily and updates the data monthly. History runs from 2007 to the latest available year, with a medium-term forecast on top.
Does IndexBox have an API?
Yes. API access is included on Business with up to 10,000 calls per month and on Enterprise with up to 100,000. You generate a key in your account, and the data is licensed for personal or internal business use only, not resale.
Can I cancel or get a refund?
You can cancel any time under Room, then Manage Subscription, then Cancel Subscription, and keep access until the paid period ends. All payments are non-refundable, including credits.
Can I buy a single report instead of a subscription?
Yes. The report store sells individual market reports, with featured reports listed at $4,000 each, and you can request a sample before buying. Custom research is priced on request.
Which languages does IndexBox support?
The public website is offered in 12 languages, including English, German, French, Spanish, Simplified and Traditional Chinese, Japanese, Korean and Arabic. Prices in the platform are converted to US dollars.
Similar tools
 HexCollaborative analytics workspace that mixes SQL, Python and AI agents in notebooks, then publishes results as data apps and plain-language answers.
 WindwardMaritime AI platform that fuses AIS, satellite and ownership data into vessel risk scores, sanctions screening, alerts and container ETAs.
 Delve AIAI market research platform that builds personas from analytics, CRM and social data, then lets you chat with them or run synthetic