

Julius
Data AnalysisUpdated October 5, 2026
Julius is a no-code AI data analyst that transforms complex spreadsheets into interactive visualizations using natural language.
We may earn a commission when you sign up through our links. It does not affect our reviews.
What is Julius?
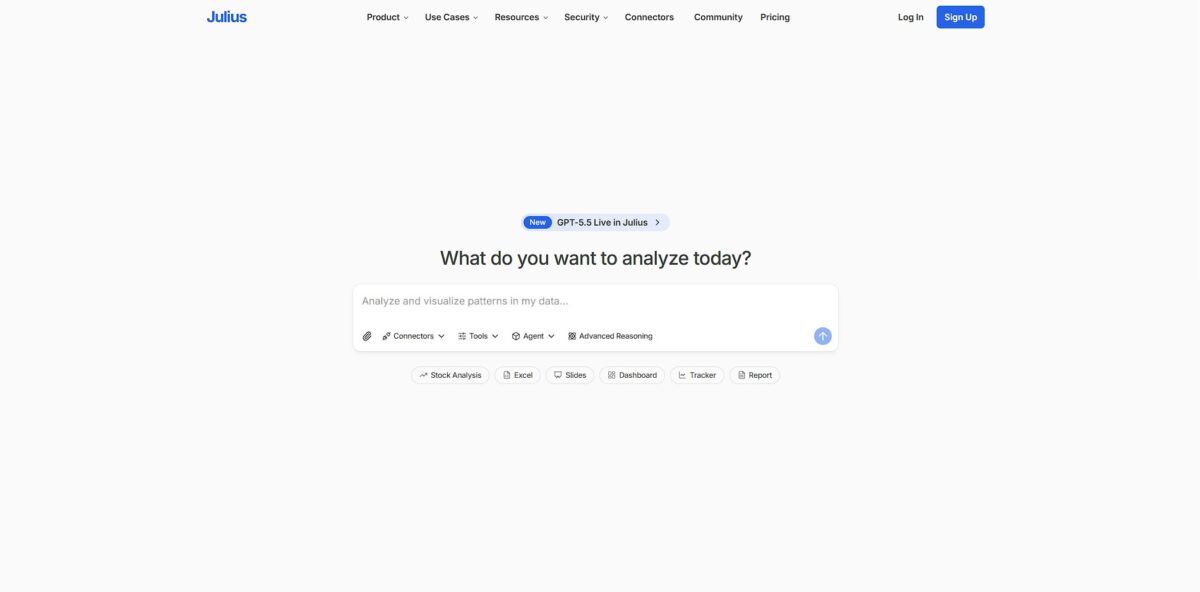
Julius acts as an AI-driven sandbox where you can interrogate spreadsheets or databases using plain English instead of wrestling with VLOOKUPs or SQL joins. It writes and executes Python or R code behind the scenes to transform messy CSVs into interactive charts or statistical summaries. I noticed it handles multi-tab Excel files without the usual formatting headaches, which saves you from manual merging. This approach bridges the gap between raw data and final reports for anyone who isn’t a data scientist. It helps you find specific trends, like quarterly revenue shifts, without touching a single line of code. It excels at rapid exploration but might feel like overkill for simple, two-column lists. Use it when you need to spot outliers in large datasets fast.
How to start using Julius?
Start by logging in and heading to the clean workspace page. Click the paperclip icon to upload your files, whether they are messy Excel sheets, PDFs, or JSON exports. You can also link Google Sheets directly if you want to skip manual exports. Julius handles text and images, which is useful when you have data trapped in screenshots or scanned documents. This centralizes your raw information so you can stop jumping between tabs.
Once uploaded, the interface shows a preview and suggests initial questions based on your headers. Don’t feel forced to use them; instead, type a specific instruction like “identify missing values and duplicates” or “summarize the performance trends.” This triggers Julius to write and run Python code in the background. You get results without ever touching a script, which helps if you need quick answers but aren’t in the mood to debug syntax.
The real shift happens when you ask for visualizations. Tell it to “show a bar plot of sales by category” or “plot age versus income as a scatter plot.” It generates charts instantly, and you can right-click to copy or download them for your reports. If the chart looks off, just tell it to change the colors or filter out specific outliers. This iterative “chatting” replaces the 20-click menu diving found in traditional BI tools.
If you find a workflow that works—like a specific data cleaning sequence—save it as a notebook template. You can then run those same prompts on new datasets to get consistent results every time. This is great for monthly reporting where the data structure stays the same but the numbers change. It turns a one-off analysis into a repeatable system.
Who is it for?
Spreadsheet Power Users
You live in Excel but want to skip the nested formulas. Julius writes the Python code to join tabs or clean messy dates while you just watch the results appear. No more hours troubleshooting syntax errors in a tiny formula bar.
Academic Researchers
Use it to chat with your CSV datasets and generate publication-ready plots. It handles the heavy lifting of statistical significance testing without requiring a PhD in R. Your attention stays on the hypothesis instead of the plotting library documentation.
Marketing Analysts
Drop in a dump from Google Ads or Shopify to find why conversion dipped last Tuesday. It spots the correlation between regional spend and bounce rates that usually hides in a pivot table. You walk into the client meeting with a clear answer and no manual slicing.
Small Business Owners
Perfect for checking sales trends or inventory cycles when you don’t have a data team. You ask “which product is losing money?” and get a chart, though it struggles if your data isn’t in a structured table. Quick visual feedback helps you stop wasting money on slow-moving stock.
Data Science Students
Great for verifying your manual calculations or seeing how a specific regression model looks in code. It provides a conversational “tutor” feel while you learn how to manipulate data frames. This matters because seeing the AI’s logic helps bridge the gap between theory and practical coding.
Julius pricing
Julius AI keeps its pricing tiers tied to how much you talk to your data and how much heavy lifting you need from the underlying hardware. You can start for nothing to see if it actually handles your messy CSVs. If you are doing more than a few quick charts a month, you will hit the limits fast. It is a classic SaaS ladder where the value scales with your project complexity.
Free Plan: $0. You get 15 messages a month for basic analysis. This works if you just need one specific chart for a presentation, and it lets you verify its logic before spending a cent.
Plus Plan: $20/month or $16 billed yearly. Limits expand to 250 messages. This is where most solo users land when they start automating weekly reports, and it takes the credit anxiety out of a deep dive.
Pro Plan: $45/month or $37 billed yearly. The big jump here is the 32GB RAM boost and unlimited messages. Large datasets that usually crash basic browser tools actually process here. You no longer need a local high-performance Python environment.
Business Plan: $450/month or $375 billed yearly. This adds 10 seats and 45,000 credits while connecting directly to Postgres or BigQuery. This matters because it lets teams query live production data without writing SQL.
Grab the Plus annual plan to save roughly 20% once you are certain the AI parses your specific column headers correctly.
Julius key features
Prompt-to-Python execution
Type a question and watch Julius write and run code to probe your dataset. This bypasses the need to manually script every pandas join or filter while keeping the logic transparent. You get technical results without needing to remember exact syntax for every library.
Automated data cleaning routines
Julius handles common headaches like fixing inconsistent date formats or filling null values based on your verbal instructions. It transforms a messy CSV into an organized foundation without you touching a single Excel cell. You get back the hour you usually spend hunting for formatting errors.
Dynamic chart generation
Create anything from standard bar graphs to complex heatmaps and geospatial plots by describing the visual you want. It removes the friction of toggling through visualization menus and guessing which axis goes where. In practice, you can iterate through five different chart types in the time it usually takes to build one.
Advanced statistical modeling
The tool conducts Chi-Square tests, correlation analysis, and linear regressions through chat. It simplifies academic-grade math into readable results for research papers or business forecasts. Users who aren’t trained statisticians get access to deeper insights.
Direct database and file connectors
Link Google Sheets, Postgres, or Excel files to keep your analysis tied to live data sources. This setup stops the “download-upload” loop that usually fragments your workflow. Your analysis stays current as your underlying data changes.
Animated GIF and PDF exporting
Turn static data into moving visualizations or structured reports for quick sharing. This makes findings more digestible for stakeholders who won’t look at a raw table. Your work comes out in a “presentation-ready” format instantly.
Julius Pros & Cons
Pros
Julius eliminates the friction of writing Python or SQL to extract insights from raw spreadsheets and databases. You can simply ask for a trend analysis or a specific correlation in plain English, and the tool generates the necessary code and visualizations instantly. I noticed it handles messy data cleaning—like filling null values with column means—directly within the chat interface, which saves you from jumping back into Excel for manual fixes. The transparency is a major win; you can toggle the “Show Code” option to verify the underlying logic or learn how the calculation works. This keeps your analysis grounded in reality while accelerating the boring parts of data preparation. Use the Notebooks feature to save these workflows and re-run them when you have fresh data.
Cons
The chat-based approach can feel restrictive when you need to perform high-precision formatting or complex multi-step data transformations that require visual oversight. While the AI is adept at standard statistical tests, it occasionally needs very specific prompting to avoid generic interpretations of outliers. I observed that high-volume datasets might push the limits of the browser-based interface, sometimes leading to slower response times compared to a local Jupyter environment. Relying on an LLM for logic means you must stay vigilant; a slight misinterpretation of a column header can skew a whole report if you don’t check the generated code. Verify the data dictionary early in the session so the AI doesn’t hallucinate relationships between unrelated variables.
Use Julius if you want…
- Chat with your CSV files using natural language.
- Generate instant Python-backed visualizations from raw datasets.
- Analyze structured files without writing a single line of code.
- Uncover hidden trends through intuitive AI-driven conversations.
- Turn complex spreadsheets into actionable business insights quickly.
- Explore data modeling via simple plain English prompts.
- Automate repetitive data cleaning and preparation tasks effortlessly.
Julius alternatives
 HexRead review →
 Powerdrill AIRead review →
 ChatGPT Advanced Data AnalysisRead review →
 TableauRead review →
Julius Reviews
The natural language queries are incredibly intuitive; I saved hours on a research project by just asking for specific chart types and data summaries without touching a single formula.
It’s like having a data wizard in my phone that handles messy spreadsheets in minutes, though I have to be careful with column labels to avoid the occasional hallucination.
Excellent for quick visualizations and preliminary analysis, but the monthly usage caps are a bit restrictive for heavy professional use.
I love that it shows the underlying Python code for transparency, making it a great learning tool even if it occasionally struggles with very large, complex datasets.
FAQ
What data formats does Julius support?
Julius supports a wide range of file formats including spreadsheets such as Excel and CSV, Google Sheets, PDFs, images, and text-based files like DOCX and TXT.
Can Julius analyze spreadsheets with multiple tabs?
Yes, you can upload multi-tab spreadsheets and refer to specific tab names in your natural language prompts for targeted analysis.
How does Julius handle data privacy?
Julius employs strict access controls where users only access their own data in sandboxed environments, and all data is completely erased from servers upon deletion within the app.
Can I generate visualizations with Julius?
Yes, Julius can automatically generate various types of charts and graphs, including bar plots, line plots, histograms, and scatter plots, based on your text commands.
Does Julius require coding knowledge to use?
No, Julius is designed to be a no-code tool that translates natural language commands into Python code to perform complex data transformations and statistical analysis.
What should I do if the AI produces an error or hallucination?
If the output is inaccurate or looping, try rewording your prompt to be more specific or start a new thread to refresh the AI context.
Is there a free version of Julius?
Yes, by default all users can send a limited number of messages per month to test the platform’s capabilities with its most advanced AI models.
Can I link a Postgres database to Julius?
Yes, you can connect external data sources like Postgres databases by providing a connection string directly in the chat or through the file management page.
Similar tools
HexCollaborative analytics workspace that mixes SQL, Python and AI agents in notebooks, then publishes results as data apps and plain-language answers. WindwardMaritime AI platform that fuses AIS, satellite and ownership data into vessel risk scores, sanctions screening, alerts and container ETAs.
 Delve AIAI market research platform that builds personas from analytics, CRM and social data, then lets you chat with them or run synthetic