
Middleware
AI AssistantsUpdated November 17, 2026
Full-stack observability platform for logs, metrics, traces and user sessions, with an OpsAI SRE agent that finds root causes and opens fix PRs.
We may earn a commission when you sign up through our links. It does not affect our reviews.
What is Middleware?
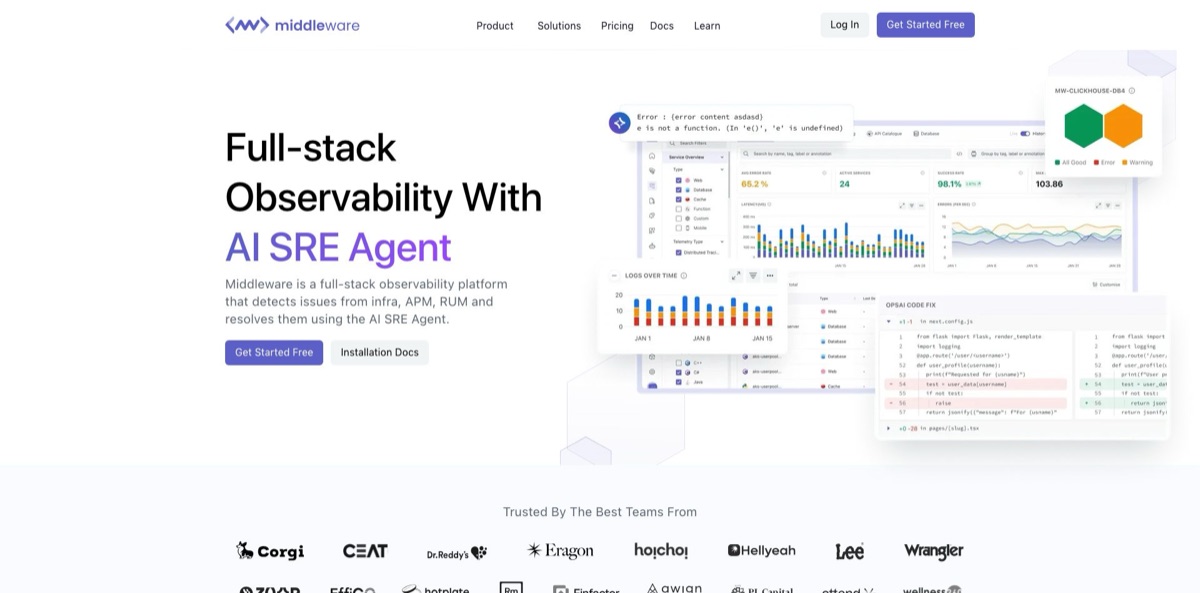
Middleware is a hosted, OpenTelemetry-based platform that pulls infrastructure metrics, logs, distributed traces, real user sessions and synthetic checks into one account, then runs an AI SRE agent called OpsAI on top of that data. OpsAI watches APM, RUM and Kubernetes telemetry, explains the likely root cause of an error, and can open a pull request with a proposed fix or, on Kubernetes, apply a remediation itself. The commercial pitch is aimed at the cost and tool sprawl of incumbents such as Datadog and New Relic: billing follows the gigabytes you store rather than hosts or seats. The weak spots are a younger integration catalogue and community than the market leaders, plus a learning curve that G2 reviewers mention again and again. It fits startups and mid-size engineering teams that want full-stack monitoring and AI-assisted debugging without an enterprise contract.
How to start using Middleware?
Create an account at app.middleware.io; no credit card is required. New accounts land on the Free Forever plan, and the pricing FAQ also mentions a 14-day trial with unlimited data ingestion, so you can send real production volume before deciding what to pay for. Inside the app you get an ingestion API key and a unique account URL in the form https://<your-uid>.middleware.io, which every agent and SDK needs.
Install the infrastructure agent where your code runs. On Linux it is a single command that passes MW_API_KEY and MW_TARGET to a DEB or RPM install script; there are equivalent agents for Docker, Windows and Kubernetes. The agent wants at least 1 GB of memory on the host and uses about 200 MB itself. Check it with sudo systemctl status mw-agent, then open Infrastructure Monitoring, Hosts to confirm metrics are arriving. On recent kernels the Linux agent can also discover running services and instrument them through OpenTelemetry eBPF (OBI) with mw-agent instrument, without code changes or restarts.
Next, add depth. Install the APM agent for your language (Java, Node.js, Next.js, Python and Go are covered) and the RUM SDK for JavaScript, iOS or Android if you care about frontend sessions. To switch on OpsAI, connect your GitHub or Bitbucket repository so it can read the files tied to a specific error, and for clusters install the Kube Agent with opsai.enabled=true. In the OpsAI settings you pick Auto RCA, where it only suggests fixes, or Auto Fix, where it applies supported Kubernetes changes itself. Connecting Slack lets your team tag @Middleware in an alert thread.
Finally, check what OpsAI found. OpsAI Home lists detected issues; open one, start an investigation and read the root cause, the evidence from logs and traces, and the side-by-side code diff before you click to create a pull request. The documentation is explicit that a generated pull request is a proposal, not a guarantee, so it goes through your normal review and test pipeline. Before you move to paid usage, set ingestion rules in the data pipeline so noisy logs never reach billable storage.
Instrument one service and one cluster first, and keep OpsAI on Auto RCA for a couple of weeks before you trust Auto Fix in production.
Who is it for?
Startup CTOs
You need logs, traces and infrastructure metrics in one place, but a per-host contract with a big vendor eats the cloud budget. Middleware starts free with unlimited users and then charges by stored gigabyte, so cost tracks how much data you keep. You can monitor everything from day one and tune volume later.
On-call SREs
Your nights go to stitching together a stack trace, three dashboards and a log search before you even know which service broke. OpsAI collects that context, writes a root cause summary and drafts the fix, so the human job shifts from digging to reviewing. Incident threads in Slack get the same analysis on request.
Kubernetes platform teams
Crash-looping pods and misconfigured workloads are repetitive problems with known fixes. The Kube Agent gives cluster, node and pod visibility, and Auto Fix can apply supported remediations directly once you grant write permissions. You keep a review step by staying on Auto RCA.
Teams leaving Datadog or New Relic
Migration risk usually stalls cost-cutting projects. Middleware documents a cutover where you keep the Datadog agent and dual-ship to both backends, or point existing OpenTelemetry exporters at it, and OpsAI can investigate Datadog and Grafana alerts without moving data first. You compare both tools on real traffic before switching.
AI engineers shipping LLM apps
Prompt failures, token costs and quality drift are hard to see in classic APM. The LLM Observability module shows tokens and cost per call next to each trace, adds a model playground and LLM-as-a-judge evaluations, and tracks GPU metrics. Regressions show up before users complain.
Frontend and QA teams
Real user monitoring, session replays, synthetic API checks and browser tests live in the same account as backend traces. A slow page can be followed from the browser session down to the database call. A public status page is also included.
Middleware pricing
Middleware uses usage-based pricing with no per-seat line on the pricing page. Data is measured daily by type and source and billed on what is actually stored, so anything you drop in the data pipeline is not charged. Real user sessions, synthetic checks and browser test runs are priced separately per thousand, and OpsAI investigations are billed by the tokens they consume. The official calculator subtracts the free allowance before pricing additional usage. Startups and nonprofits can ask sales about discounts.
Up to 100 GB of data, 1,000 RUM sessions, 20,000 synthetic checks and 10 browser test runs, plus a one-time grant of 2 million OpsAI tokens. Unlimited users, community support and 14-day retention.
Add $1 per 1,000 RUM sessions, $1 per 5,000 synthetic checks and $10 per 1,000 browser test runs. You get error solving with OpsAI, ingestion control and the data pipeline, SSO and security features, a dedicated Slack or Microsoft Teams channel and 30-day default retention. You can cancel at any time, and data stays available for 30 days to download.
Custom. Volume and multi-year contract discounts, custom retention, a dedicated account team, 24x7 support and the option to run on your own cloud.
Issue detection is free on every plan. Root cause analysis and automated fixes are charged by token usage; the calculator estimates cost per issue fix, but the pricing page warns that token use per issue varies with type and complexity.
Middleware key features
OpsAI SRE agent
It detects backend errors from APM, frontend crashes from RUM and Kubernetes pod failures, correlates stack traces, logs and metrics, and explains the likely cause. For application errors it reads only the related files through a GitHub connection and opens a pull request with a clean diff; for Kubernetes it can apply the fix directly.
Ask OpsAI chat
You ask plain-English questions such as which pods are unhealthy or why a service’s latency is rising, from OpsAI Home or from the Infrastructure, APM and Logs screens with the current item passed as context. The same assistant answers in Slack when you mention @Middleware, can build dashboard widgets from a description, and can run your own runbooks saved as OpsAI Skills. On-call engineers skip most of the query writing.
Unified telemetry on one timeline
Infrastructure monitoring, APM with distributed tracing and a continuous profiler, log management, database monitoring, RUM with session replays, synthetic monitoring, browser testing and status pages share one data store. Correlated views let you jump from a slow page load to the trace and the log line behind it. Fewer tools means fewer tabs open during an incident.
OpenTelemetry-native collection
Agents are built on OpenTelemetry, the company lists 450+ agents and integrations, and Prometheus and other collectors are accepted. On Linux, eBPF-based OBI instrumentation captures HTTP, gRPC and database calls without code changes. Your instrumentation stays portable if you ever change vendors.
Ingestion control and data pipeline
Filters decide what gets stored before it reaches billable storage, recent releases added data ingestion caps, and sensitive values such as emails, credit card numbers, phone numbers and IP addresses are masked by default. This is the main lever for keeping pay-as-you-go costs predictable.
LLM Observability
Traces for LLM apps and agents show prompts, full chat history, token counts and per-call cost, alongside a playground for comparing models and LLM-as-a-judge evaluations that score outputs against your rules. GPU metrics and 50+ prebuilt LLM dashboard metrics sit in the same platform.
Hosted MCP server
A remote endpoint exposes 24 tools across six areas, from querying logs, metrics and traces to managing dashboards and RUM sessions, to Claude, Cursor, VS Code, Windsurf, Gemini CLI, Codex CLI and other MCP clients. Developers can check production errors from the IDE instead of switching to the web UI.
Middleware Pros & Cons
Pros
Middleware gives a small team the full observability stack without the usual per-host pricing shock. The free tier is generous for side projects and early startups, users are unlimited, and pay-as-you-go pricing is stated per gigabyte on the public page rather than hidden behind a sales call. Reviewers on G2 repeatedly praise quick agent deployment, especially on Kubernetes, and a single dashboard for logs, metrics and traces. OpsAI goes beyond alerting by drafting root cause analyses and pull requests, and it works on alerts coming from Datadog and Grafana as well. Start with the free plan on one production service to see whether OpsAI’s diagnoses match what your engineers would conclude.
Cons
The integration catalogue and community are smaller than those of Datadog or New Relic, and several reviewers had to configure niche integrations by hand. G2 summaries flag a steep learning curve for people new to APM concepts, dashboards that can feel crowded with large data sets, and limited dashboard customization. Usage pricing rewards discipline: without ingestion rules, chatty logs inflate the bill, and default retention of 14 or 30 days is short for audits. OpsAI fixes still need human review. Set ingestion filters and a retention plan before production traffic flows, and check that the integrations you rely on exist.
Use Middleware if you want…
- Monitor logs, metrics and traces in one place.
- Get AI root cause analysis for production errors.
- Turn APM errors into reviewable fix pull requests.
- Auto-remediate common Kubernetes pod and workload failures.
- Cut observability costs compared with per-host pricing.
- Investigate Datadog and Grafana alerts without migrating data.
- Track LLM token usage, cost and output quality.
- Query production telemetry from your IDE through MCP.
Middleware alternatives
Middleware Reviews
A G2 reviewer who compared it with New Relic and Datadog says the APM gives the same per-call insight at roughly 40% lower cost, though initial setup took some time.
One G2 user running a Kubernetes-heavy stack deployed the agent in minutes and got full cluster visibility, but would like more guided onboarding and a better alert management UI.
Several G2 reviewers like having application performance, infrastructure and logs on one dashboard, while noting a steep learning curve for newcomers to APM, manual steps for some integrations and thin documentation for advanced cases.
Another G2 reviewer finds the dashboard overwhelming when a lot of data is on screen and says monitoring from a phone is not as smooth as it should be.
Capterra and Software Advice reviewers from 2023 praise the easy agent install and affordability; one wanted more third-party integrations, one found custom dashboards of little use, and one thought the price was a bit high.
FAQ
Is there a free plan?
Yes. Free Forever includes up to 100 GB of data, 1,000 RUM sessions, 20,000 synthetic checks, 10 browser test runs, a one-time 2 million OpsAI tokens, unlimited users and 14-day retention.
How is data usage billed?
Middleware measures data daily by type and source and charges $0.30 per GB on pay-as-you-go for what is actually stored. Data you drop with the ingestion pipeline is not billed.
Does OpsAI change my code automatically?
Not for application code: OpsAI opens a pull request that your team reviews and merges. On Kubernetes, Auto Fix can apply supported changes directly, but only if you grant the required write permissions.
What access does OpsAI need to my repository?
It connects through a GitHub MCP connection (Bitbucket is also supported for code fixes) and reads only the files related to a specific error. Middleware says it does not scan the full codebase or store source code.
Which languages does OpsAI support?
The product page lists Java, Node.js, Python, Go and Next.js for application error fixes.
Can I keep using Datadog or Grafana?
Yes. OpsAI can ingest alerts from Datadog and Grafana and investigate them with their metrics, logs and traces, and the docs describe dual-shipping data from the Datadog agent during a migration.
Is Middleware secure and compliant?
Customer data is encrypted in transit with TLS 1.2+ and at rest with AES-256, and the site displays SOC 2 Type II, ISO 27001, HIPAA and GDPR badges. Sensitive fields such as emails and card numbers are masked by default.
Can I cancel at any time?
Yes, pay-as-you-go accounts can cancel anytime, and Middleware keeps your data for 30 days after cancellation so you can download it.
Similar tools
 MyMapAI canvas that turns a prompt, PDF or YouTube link into editable mind maps, flowcharts, SWOTs, genograms and slides, with GPT, Claude
 FirstupEnterprise employee communications platform with AI search, AI writing help and targeted delivery to app, email, intranet and signage.
 VapiDeveloper platform for building, testing and running voice AI agents that answer and place phone calls or talk to users inside apps.