

Mixpanel Spark
Data AnalysisUpdated October 5, 2026
Mixpanel Spark transforms plain-English questions into instant product metrics and automated reports using conversational generative AI.
We may earn a commission when you sign up through our links. It does not affect our reviews.
What is Mixpanel Spark?
Mixpanel Spark converts plain-English questions into product metrics and automated reports without requiring a deep dive into complex UI filters. It functions as a conversational bridge between your data and immediate answers, allowing team members to bypass the usual friction of manual query building. Instead of hunting for the right event property to calculate conversion, you type your intent and watch the dashboard populate. This approach shifts the workload from technical configuration to interpretation, making data accessible to those who don’t live in spreadsheets. While it speeds up basic discovery, users still need to verify that the LLM correctly interpreted nuances in custom events. You save time on routine reporting, which means more headspace for actual strategy. Use it to quickly validate a hunch during a meeting rather than filing a ticket for a data analyst.
How to start using Mixpanel Spark?
Open any board in your project and look for the Add Content button. Click it and select Launch Spark from the menu. This opens a chat-like interface where you skip the usual drag-and-drop report building. It feels less like configuring a database and more like asking a colleague for a quick stat. You no longer have to remember exactly which property holds your signup data.
Type a question in plain English, such as “How many users clicked upgrade last week?” Spark parses your events and returns a visualization immediately. I noticed it works best when your event names are descriptive; cryptic naming conventions like ‘btn_clk_01’ can confuse the logic. Clearer names lead to more accurate charts without manual overrides. This matters because you get to the “what happened” phase without fighting the UI.
If the first chart isn’t quite right, don’t start over. Type a follow-up to refine the results, like “Break this down by country.” Spark remembers the context of your previous question, so you can drill into specific segments naturally. It handles the grouping and filtering logic that usually requires several clicks in the standard query builder. In practice, you explore a hypothesis step-by-step through conversation.
Check the logic by clicking into the generated report to see the underlying events and filters. Spark isn’t a black box; it reveals the specific query it built so you can verify the data is actually what you asked for. If a filter looks off, you can manually adjust it in the standard editor. That transparency builds trust in the numbers before you present them to stakeholders.
Once you have the insight you need, hit Save to pin the report to your board. It becomes a standard Mixpanel card that updates in real-time like any other. You can also view your prompt history to reuse successful queries later. A quick chat thus becomes a permanent asset for your team’s dashboard.
Who is it for?
Product Managers who need to surface conversion trends without waiting for a data analyst to finish their sprint. You get answers in seconds by asking plain English questions about your funnel. This helps you pivot product strategy based on actual user behavior rather than gut feeling.
Growth Marketers mapping out campaign attribution on the fly
You can identify which channels drive the most revenue by chatting with your data instead of building complex pivot tables. It turns raw event logs into actionable spend decisions.
Data Analysts tired of answering the same “How many users did X?” tickets every Tuesday
Spark handles the basic queries, freeing you up to focus on deep-dive predictive modeling or data architecture. The bottleneck between raw data and the people who need it goes away.
Non-technical Founders monitoring KPIs during early-stage scaling
You can keep a pulse on retention and churn without learning SQL or digging through documentation. It lets you lead with data-backed confidence during investor updates.
Customer Success Leads investigating specific account health issues before a renewal call
You can quickly see which features a client stopped using to identify friction points. This insight lets you walk into meetings with a proactive plan to save the account.
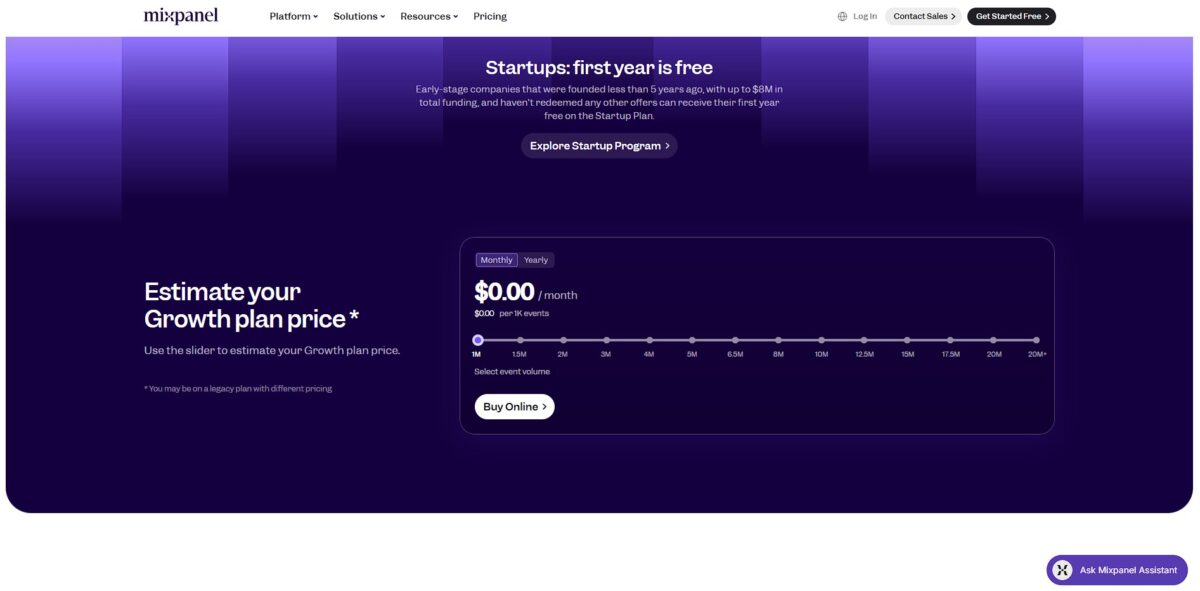
Mixpanel Spark pricing
Mixpanel ties its generative AI directly to your existing subscription rather than selling it as a standalone add-on. This means your access to the natural language interface scales alongside your data ingestion. Since it operates on prompt credits, you essentially pay for the complexity of your investigative curiosity.
Includes 30 Spark queries monthly. Good for small side projects but limits advanced cohorts.
Boosts Spark to 60 queries and adds unlimited reports. Event costs scale at roughly $0.28 per 1,000 events after your first million.
Grants 300 queries per month and adds anomaly detection. Higher tiers prevent technical bottlenecks when marketing teams need to build complex funnels without waiting for a data scientist.
Mixpanel Spark key features
Natural language querying for metrics
Type questions like “Which landing page has the highest bounce rate for mobile users?” to skip building manual filters. This helps non-technical stakeholders get answers without waiting for a data analyst’s help. The technical barrier to accessing raw product data disappears.
Automated report generation
Spark builds visualizations directly from your text prompts, turning a single sentence into a full board of charts. I noticed it saves time when you need a quick dashboard for a meeting but don’t want to drag fields for twenty minutes. You go from a blank screen to a usable report in seconds.
Conversational data exploration
Ask follow-up questions to drill into specific segments, such as “Now show me just the users from Europe,” without resetting your view. This allows for a logical flow of discovery rather than jumping between different report tabs. It mirrors the way people actually investigate problems.
Plain-English summaries of complex trends
The tool describes what a chart is showing in narrative form, highlighting spikes or dips you might miss. It works well for spotting anomalies but can be less ideal for nuanced causal analysis. You get an immediate “so what” for data points.
Integration with existing Mixpanel data
Spark uses your established events and properties, so there is no need for new tagging or schema updates. You simply use what you already have, just through a chat interface. Your current data stack gets more useful without more engineering work.
Mixpanel Spark Pros & Cons
Pros
Spark eliminates the need to manually build complex segmentation filters by translating plain-English questions into visualizations. Non-technical team members can generate conversion funnels or retention heatmaps simply by asking about user drop-off points. This accessibility removes the data analyst bottleneck for common product questions. I noticed the interface handles conversational follow-ups well, allowing you to refine a chart without starting over. Product managers can keep their flow of thought during strategy sessions.
Cons
The conversational interface relies heavily on the quality of your existing event taxonomy. If your tracking plan is a disorganized mess of overlapping event names, the AI can struggle to distinguish between similar actions. This leads to inaccurate metrics that look correct but pull from the wrong data points. While it speeds up creation, the tool cannot yet replace the nuanced reasoning needed for deep-dive root cause analysis. The trade-off is a loss of granular control over advanced math or custom properties that the UI sidebar still handles better. Why this matters: Blindly trusting an AI-generated report without understanding your data schema can lead to expensive product pivots based on hallucinations.
Use Mixpanel Spark if you want…
- Get instant product answers using plain English prompts.
- Convert complex user behavior data into visual reports.
- Skip manual filters to uncover conversion trends faster.
- Empower non-technical teams to query live product metrics.
- Bypass SQL queries for immediate revenue insights.
- Automate boring report generation with generative AI.
- Bridge the gap between raw data and strategy.
Mixpanel Spark alternatives
Mixpanel Spark Reviews
Spark is a game changer for quick questions; I can skip the complex filters and just ask for my funnel conversion in plain English.
It’s great for preliminary analysis, though I find that more nuanced, in-depth reports still require a manual touch to get the logic exactly right.
The natural language interface makes the data feel way less gatekeepy for my non-technical stakeholders, even if the setup takes some initial effort.
I love how fast I can generate a report, but the AI occasionally needs a few tries to understand my specific event naming conventions.
FAQ
Does Mixpanel use my data to train OpenAI models?
By default, no. Mixpanel does not allow OpenAI to use customer data to train its models for its own purposes, and data is not used to improve third-party generative AI models.
What types of questions can I ask Spark?
You can ask objective questions involving calculations or data modifications, such as breaking down visits by country or counting specific events; however, subjective “why” questions are not supported.
Can I edit the reports generated by Spark?
Yes, any report created by Spark is viewable and editable, allowing you to see exactly which events were used in the query and make manual modifications as needed.
Is Spark available for organizations with EU data residency?
Spark is disabled by default for customers enrolled in Mixpanel’s EU data residency program or those with signed Business Associate Addenda (BAAs).
Which AI service powers Mixpanel Spark?
Spark is powered by generative AI technology from OpenAI.
Can an administrator disable Spark?
Yes, Mixpanel admins can enable or disable Spark at any time through the Organization Settings tab.
Similar tools
 HexCollaborative analytics workspace that mixes SQL, Python and AI agents in notebooks, then publishes results as data apps and plain-language answers.
 WindwardMaritime AI platform that fuses AIS, satellite and ownership data into vessel risk scores, sanctions screening, alerts and container ETAs.
 Delve AIAI market research platform that builds personas from analytics, CRM and social data, then lets you chat with them or run synthetic