

Tableau
Data AnalysisUpdated October 5, 2026
Tableau AI is an intelligent analytics platform that simplifies data exploration and delivers personalized, predictive insights across your workflow.
We may earn a commission when you sign up through our links. It does not affect our reviews.
What is Tableau?
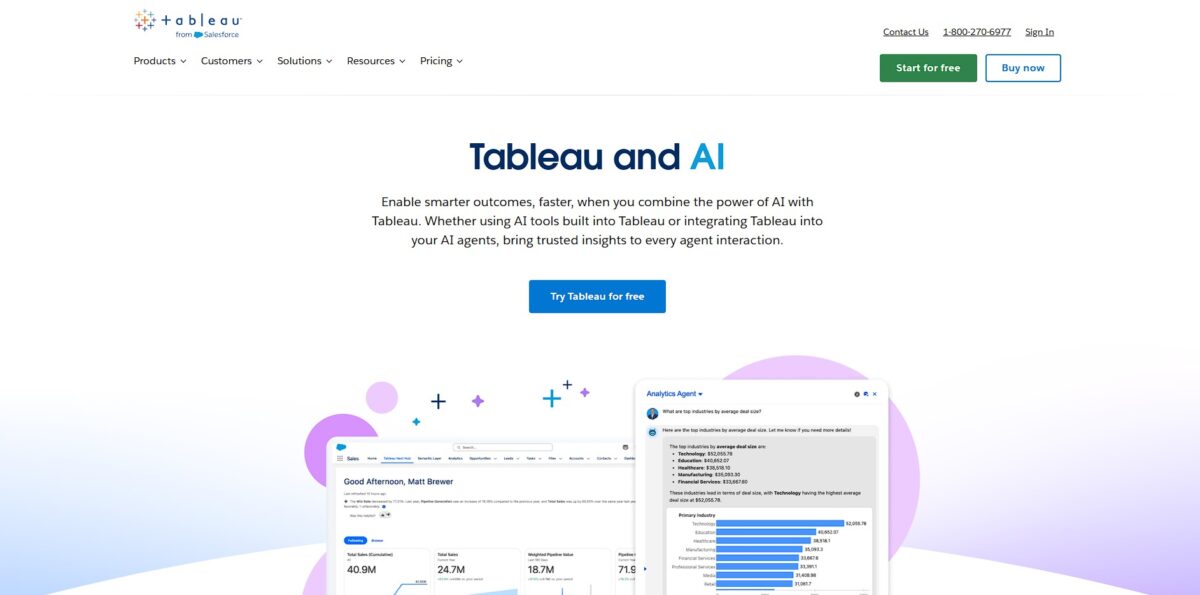
Tableau is a visual analytics engine that pulls data from static spreadsheets or live SQL databases to build interactive dashboards. It swaps rows of numbers for maps and heatmaps using a drag-and-drop canvas, letting you spot shipping delays or revenue dips without writing a single line of code. While it handles millions of rows across 75+ sources, the interface feels heavy if you just need a quick sum; I noticed it often requires a dedicated specialist to keep complex filters from breaking. This matters because it shifts data from a technical bottleneck to a shared visual narrative. If your team needs to explore deep trends rather than just viewing a report, it is the standard, though it is overkill for simple list-making. Use it when your data has a story to tell, not just numbers to store.
How to start using Tableau?
Grab Tableau Desktop to begin. You can find a trial on their site or stick to the Public version if you don’t mind your data being open to the world. Installation follows the standard wizard path. Once open, you face the Connect pane. This is where you point the app at your messy Excel files or local SQL databases. Connecting early lets you see if your data structure actually plays nice with Tableau’s logic before you sink hours into a complex dashboard.
Next, look at the Data pane. Tableau automatically sorts your columns into Dimensions and Measures. This categorization determines how you’ll slice your numbers later. I noticed that if your headers are cryptic, the app might misread a date as a string. Fix these types on the fly to avoid broken charts. Proper labeling at this stage prevents the “why is my year showing as a sum?” headache later.
Drag your first field onto the Rows or Columns shelves. The workspace reacts instantly, turning raw rows into bars or lines. It’s tempting to overcomplicate, but starting with a simple bar chart helps verify that your totals match your source. This immediate feedback loop catches data integrity issues while they’re still easy to spot. Seeing your data visually for the first time usually reveals outliers you missed in a spreadsheet.
Create a dashboard once you have a few sheets ready. You’ll drag your charts into a shared layout to see how different metrics interact. Using the dashboard’s “Use as Filter” toggle is a quick way to make the whole view interactive without writing a single line of code. This turns a static report into an exploratory tool for your team.
Who is it for?
Data Analysts
Stop spending 80% of your day cleaning messy Excel rows and spend it actually spotting trends. This shifts your role from manual data janitor to a strategic advisor who presents clear, interactive stories.
Business Intelligence Leads
You need to connect SQL queries, cloud warehouses, and local files into one unified view without waiting for an IT ticket. This helps your department make decisions based on real-time revenue targets rather than last month’s stale reports.
Enterprise Executives
If you want a birds-eye view of global supply chain bottlenecks or regional sales performance, the visual dashboards offer immediate clarity. You can drill down from a high-level map into specific store transactions to find exactly where inventory is stalling.
Digital Marketing Managers
Calculate true ROI by blending Facebook Ad conversion rates with your internal CRM sales data. Instead of guessing, you’ll see which campaigns actually turn clicks into paying customers over a 45-day window.
Logistics and Warehouse Managers
Identify why the receiving area is a choke point by visualizing lead times and stock movement patterns. You can redesign aisle layouts or storage slots based on which products move the fastest through the facility.
Research Scientists
Sifting through thousands of citations and scientific papers is a nightmare without a way to visualize supporting versus contradictory data. Tableau allows you to map out literature landscapes and group complex findings into digestible clusters.
Tableau pricing
Tableau avoids flat fees and instead bills per user based on how they touch the data. This tiered structure means you pay for specific roles rather than a blanket company license. The total cost usually depends on your ratio of builders to viewers.
This is the entry ticket for anyone needing to connect to databases and build dashboards from scratch. It includes Tableau Desktop and Tableau Prep Builder, which automates messy data cleaning. You can’t publish any new content without at least one Creator seat.
Aimed at managers who don’t build but need to tweak existing reports in a web browser. They can change filters or swap chart types without asking IT for help. Teams get to find their own answers without breaking the master dashboard.
These users only see and interact with dashboards others have built. It’s a read-only role that allows for filtering and data exporting. That’s how you share insights across a large department without paying for expensive editing tools.
A free version for creators who don’t mind their data and visualizations being visible to the entire internet. It’s a zero-cost way to build a public portfolio or learn the software.
Tableau key features
Drag-and-drop Viz Builder
Skip the code and build complex charts by moving fields onto a canvas. This speeds up exploration because you see data changes instantly without writing SQL or formulas.
AI-Powered Tableau Pulse
Get automated digests of your key metrics delivered where you already work. It cuts through dashboard noise by surfacing why a number spiked or dipped using natural language summaries.
Tableau Prep for Data Wrangling
Clean and combine messy datasets using a visual flow rather than manual spreadsheet formulas. You can spot missing values or data gaps immediately in the profile pane before they break your final report.
Natural Language Queries with Tableau Agent
Ask questions like “What were sales in the West last quarter?” to generate a visualization automatically. This lowers the barrier for team members who do not know the underlying data structure but need quick answers.
Interactive Dashboard Interactivity
Create filters, tooltips, and actions that let viewers drill into specifics themselves. Instead of sending ten different static reports, you provide one sandbox where users can explore different regions or timeframes.
Live and In-Memory Data Connections
Switch between a live feed for real-time monitoring or an extracted snapshot for faster performance on massive datasets. This flexibility lets you balance the need for fresh data against the hardware limits of your viewer’s machine.
Tableau Pros & Cons
Pros
Tableau excels at turning messy datasets into interactive dashboards without requiring deep code. The drag-and-drop interface lets you spot outliers or seasonal trends in seconds, which helps teams move from staring at rows to making actual decisions. I noticed the mapping features handle geographic data better than most spreadsheets, automatically plotting coordinates or zip codes with precision. The new AI-driven Pulse feature sends plain-language metric updates directly to Slack, so you don’t have to go digging through a complex workbook just to check your North Star metrics. This keeps the whole team aligned on the same data foundation without technical bottlenecks. Focus on building clean data sources first so the visual layer stays fast and accurate.
Cons
The price point is steep and targets enterprise budgets rather than solo builders or small startups. While the visuals look great, the initial setup and data modeling require a significant learning curve for anyone used to simple grid tools. The software can feel sluggish when connecting to live, high-volume data sources unless you optimize your extracts perfectly. That matters because a slow dashboard often leads to lower adoption across your organization. It also struggles with complex logic or advanced math compared to a dedicated Python environment, sometimes forcing you to pre-process data elsewhere. Use Tableau for the final presentation and exploration, but handle heavy data cleaning in a separate tool to avoid performance hits.
Use Tableau if you want…
- Turn boring spreadsheets into interactive visual masterpieces.
- Uncover hidden correlations across massive, complex datasets.
- Build pixel-perfect dashboards that impress every stakeholder.
- Empower non-technical teams to explore data independently.
- Predict future trends using advanced predictive analytics.
- Merge siloed data sources into one unified view.
- Scale your business intelligence with enterprise-grade security.
Tableau alternatives
Tableau Reviews
The background research is top-tier, but the actual dashboard generation feels like it’s still in beta.
Pulse is great for quick automated metrics, but Einstein Copilot still struggles with complex calculated fields.
It saves time on metadata and descriptions, though the natural language queries often require specific phrasing to work.
A decent assistant for basic data prep, but it hasn’t replaced my need for manual SQL and LOD expressions yet.
FAQ
Is Tableau HIPAA compliant?
Tableau Cloud can support HIPAA-regulated workloads when covered by a signed Salesforce Business Associate Addendum and configured with appropriate security controls, while Tableau Server shifts infrastructure responsibility to the user organization.
What is the Einstein Trust Layer in Tableau?
The Einstein Trust Layer is a security framework that protects data privacy by masking sensitive information and preventing customer data from being used to train external large language models.
Does Tableau support real-time data analysis?
Tableau provides real-time access to data through live connections and features like Tableau Pulse, which delivers automated metric alerts and plain-language insights as changes happen.
Can I use Tableau for unstructured data?
Through integration with Data Cloud, Tableau can analyze unstructured data like call transcripts or help articles by converting them into searchable vectors to identify trends and semantic similarities.
What are Tableau Accelerators?
Tableau Accelerators are ready-to-use, pre-built dashboards designed for specific industries or business cases that allow users to jumpstart their data analysis without building visualizations from scratch.
How does Tableau Agent differ from other AI assistants?
Tableau Agent is specifically designed to be aware of the context and semantics of your unique datasets within the Tableau environment, allowing for more precise natural language queries and automated data preparation.
Similar tools
 HexCollaborative analytics workspace that mixes SQL, Python and AI agents in notebooks, then publishes results as data apps and plain-language answers.
 WindwardMaritime AI platform that fuses AIS, satellite and ownership data into vessel risk scores, sanctions screening, alerts and container ETAs.
 Delve AIAI market research platform that builds personas from analytics, CRM and social data, then lets you chat with them or run synthetic