

Ultimaps
Data AnalysisUpdated October 26, 2026
Browser-based map maker that turns spreadsheets or plain-language AI prompts into colored region maps, with PNG, SVG and PDF export and interactive embeds.
We may earn a commission when you sign up through our links. It does not affect our reviews.
What is Ultimaps?
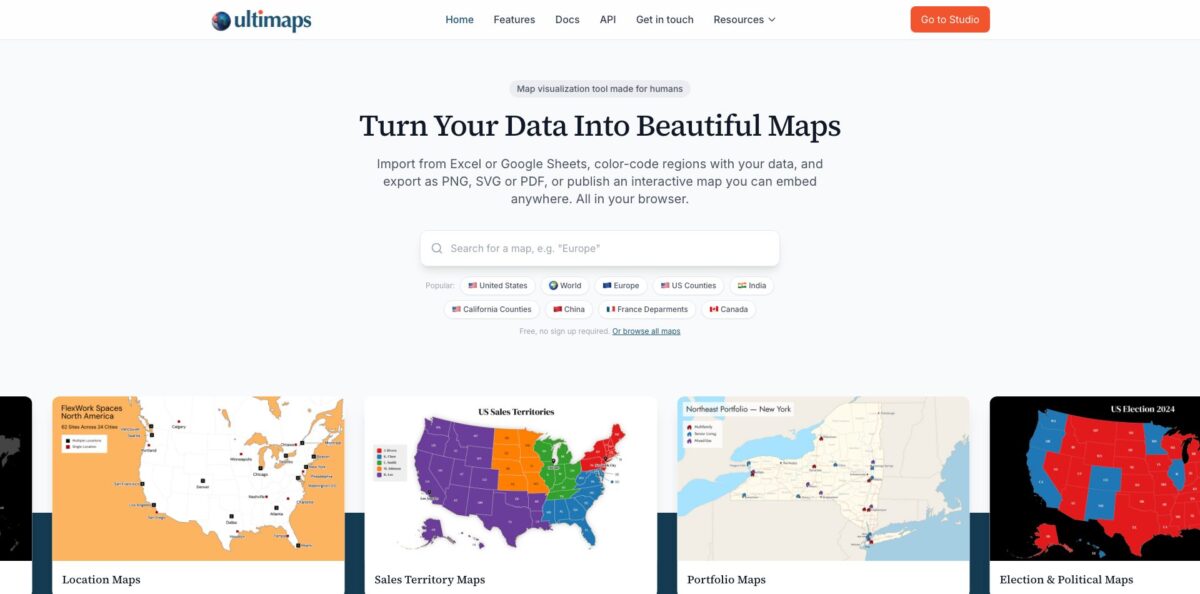
Ultimaps is a browser-based map maker built for data visualization. You pick one of 200+ vector base maps (the world, continents, countries split by state or province, US counties, US ZIP code areas), color it from a spreadsheet or a plain-language prompt, and export a PNG, SVG or PDF or publish an interactive embed. The AI layer is practical: type something like “color states by population”, paste a list of territories into the prompt, or upload a picture of an existing map, and the AI turns it into an editable map you review before it is applied. It replaces fiddly GIS work for anyone who just needs regions colored by a metric. The weak spot is scope, since there are no shapefile uploads, no custom boundaries, no city maps and no spatial analysis. Pick it when you need a clean region map for a report, slide or website fast.
How to start using Ultimaps?
Go to studio.ultimaps.com. No account or card is needed, and you land on the Pick a base map screen with popular maps at the top and the full catalog grouped by region below. The search field understands region types, so queries like “Texas counties” or “ZIP codes” work. Select a map, choose a version if the card shows “2 options”, and click Open in Editor. A free account only becomes necessary when you want to save your work, publish an interactive map or use AI requests.
The Studio opens with a panel titled How do you want to start? Set Canvas Size first: Fit map follows the outline of the map and is the default, while 16:9, 1:1 and 4:3 suit slides and social posts. Then choose Color Manually, Upload File or Use AI. For a spreadsheet, keep the Regions tab selected (the Locations tab is for pins), drop a CSV or Excel file, or paste a Google Sheets or Notion link under Import from URL. For the AI route, describe the map in plain words, for example which sales rep covers which states plus a pin for headquarters, and send it with the arrow button.
Both routes lead to the Review Data screen, which shows how many rows matched a region and flags rows that were corrected or not found. Your columns are sorted into three cards: Regions for matching, Visualize for the column that colors the map, and Import Only for extra fields you want in tooltips or popups. Click Apply to Map and Ultimaps builds the palette, value ranges and legend for you. Under Map Style you can switch the Theme (Paper by default, or Dark, Vintage and Outline), and Choropleth Settings let you change the Type to Gradient, Steps or Groups with a Break Method such as Quantile or Jenks Natural.
When the map looks right, click Export. Free download gives you a screen-size PNG with a small “Made with ultimaps.com” watermark, while Professional buys a 24-hour pass for that map with a high-resolution PNG, SVG and PDF. For an interactive version, click Share and Embed, hover a few regions to check the tooltips, then click Publish to get a share link and a View Embed Code button with an iframe snippet. Interactive Settings in the left rail control tooltip text, hover behavior, popups and click-through links. Maps stay private until you publish them.
Who is it for?
Sales operations managers
Territory maps often live in a slide someone repainted by hand two quarters ago. Ultimaps colors states, counties or ZIP areas by rep straight from a spreadsheet column and adds the legend automatically. When territories change, you re-import the file instead of redrawing the map.
Journalists and bloggers
Election results and regional statistics read better when visitors can hover a region and see the number. Published maps carry tooltips and popups, and pasting the link into WordPress, Ghost, Substack or Notion turns it into a live embed. Edits made after publishing show up in the embedded version with no new code.
Researchers and nonprofit analysts
Survey, income or health data by region becomes a choropleth with a suggested palette and breakpoints, and you can switch to Quantile or Jenks Natural when the default classes hide the pattern. SVG and PDF exports stay sharp in print. Nonprofits get 30% off subscriptions.
Teachers and students
Free blank maps and the Color Manually tool cover classroom projects without any GIS training. Free exports can be used as long as the small credit stays visible, which is fine for a worksheet or a slide. The AI prompt is a quick way to draft a map before checking the facts.
Real estate and operations teams
Property portfolios, offices and service areas can be pinned by address or coordinates on top of colored regions. Popups pull details from your data columns, so one template covers every location. The finished map embeds in an investor page or a company website.
Developers and AI assistant users: The Map Image API returns a PNG from a single URL with no key, and the MCP server lets Claude, ChatGPT or Cursor render maps inside a conversation. Every API image links back to Studio for manual edits.
Ultimaps pricing
The model is freemium with a pay-per-map option sitting between the free plan and the subscription. Making maps is never capped; you pay for high-resolution and vector exports, maps without the ultimaps.com credit, and larger monthly allowances of AI requests and address lookups. Ultimaps bills in euros, so the dollar prices on the official pricing page are approximate and the final charge depends on your card’s exchange rate.
Unlimited maps, imports from Excel, CSV, Google Sheets or Notion, 100 address lookups and 20 AI requests a month, PNG export with the credit, commercial use as long as the credit stays visible, and interactive maps you can embed (publishing needs a free account).
A high-resolution PNG, SVG and PDF of one map without the credit, files cleared for commercial use, and 24 hours to keep editing and re-exporting that map.
Unlimited exports without the credit, PNG at six times screen resolution (about 7000×7000px) plus SVG and PDF, unbranded interactive maps, templates and duplicates, 5,000 address lookups and 500 AI requests a month, and priority email support. You can cancel anytime, and Pro keeps running to the end of the paid period.
Custom. Everything in Pro plus custom maps for any region (from about $57 per map, usually built in 1 to 3 business days), custom themes and fonts, workspace users and custom interactive logic.
Developers get separate API limits. Keyless requests return watermarked PNGs at up to 30 per hour per IP, a free key allows 500 renders a month, and a Pro key raises that to 5,000 renders with SVG output and no watermark. Refunds are limited to failures on the Ultimaps side, plus a 7-day window to reverse an auto-renewal you have not used.
Ultimaps key features
AI map building from a prompt
Choose Use AI and describe the map in plain language, paste raw data into the prompt, or ask the AI to generate a dataset. The result goes through the same review screen as a file import, then the AI colors regions, builds the legend and adds titles and pins, all of which stay editable. Each prompt uses one AI request (20 a month on Free, 500 on Pro), and the AI cannot add, remove or split regions.
Map import from a picture
Upload a screenshot or a photo of a printed map, and the AI reads its legend, region colors and labeled pins into an editable map. You review the result before it is applied, so misread colors can be corrected first. It is a quick way to revive an old static map.
Spreadsheet import with automatic region matching
Excel, CSV, Google Sheets, Notion or pasted text are matched to regions, including abbreviations and spelling variants, and unmatched rows are flagged on the Review Data screen. Numbers become a choropleth with a suggested palette, classes and break method, while text values get one color per category. Imports are one-time snapshots, but a re-import keeps your manual colors, tooltips and renamed legend items.
A catalog of 200+ base maps
The library covers the world and every continent by country, an Equal Earth world map, major countries by state, province or department, the US by state and county, and ZIP code maps for every state. The ZIP maps use Census ZCTA boundaries, which approximate USPS ZIP codes but do not match them exactly, so verify them before using them for delivery zones. Anything missing can be ordered as a custom map.
Interactive maps and embeds
Published maps support hover tooltips, click popups, links to any URL, pan and zoom, and an interactive legend that highlights the matching regions. Tooltip and popup content comes from your data columns, so one template fills every region. Paste the link into Notion, WordPress, Ghost or Substack for a live embed, or use the iframe code anywhere else.
Styling, labels and export
You get themes, palettes, gradients, patterns, borders and effects like shadows and glows, plus labels that show region names, values or both, and callouts with leader lines. Selected maps also offer extra layers such as roads, cities and rivers. Exports come as PNG, SVG or PDF, and the vector files can be edited further in Illustrator or Figma.
Map Image API and MCP server
One URL renders a choropleth, category or pin map as a PNG with no account, and a POST request with a key allows bigger canvases. The MCP server exposes render_map, list_maps and get_map_regions to Claude, ChatGPT, Cursor and other clients, either by URL or as the @ultimaps/mcp npm package.
Ultimaps Pros & Cons
Pros
Ultimaps removes most of the busywork from region maps. Automatic region matching, suggested color scales and legends that build themselves mean a spreadsheet becomes a publishable choropleth in a few clicks, and the AI prompt covers quick maps where building a spreadsheet would be overkill. The free plan has no map cap and allows commercial use with the credit, which is generous for this category. Interactive embeds with data-driven tooltips, plus links that auto-embed in WordPress, Notion, Ghost and Substack, go well beyond a static image export. The API and MCP server are a real bonus for developers and AI assistant users. Start on the free plan and pay only when you actually need a clean export.
Cons
The scope is narrow by design. You cannot upload shapefiles or draw custom boundaries, the smallest units are counties, departments and ZIP code areas, and there is no spatial analysis, so anything beyond coloring regions and placing pins needs QGIS, ArcGIS or a BI tool. Google Sheets and Notion imports are one-time snapshots rather than live connections. The free plan includes only 20 AI requests a month, and the AI cannot change the regions themselves. Workspace users sit in the Custom tier rather than Pro, and billing is in euros, so US buyers see approximate dollar amounts. Independent reviews are still scarce. Test your real dataset on the free plan before you commit to a yearly plan.
Use Ultimaps if you want…
- Turn spreadsheet data into colored region maps quickly.
- Describe a map in plain words and edit the result.
- Rebuild an old map image as an editable map.
- Map sales territories by state, county or ZIP code.
- Embed interactive maps in WordPress, Notion or Substack.
- Export print-ready SVG and PDF maps without watermarks.
- Pin offices or stores by address on colored regions.
- Generate map images from an API or AI assistant.
Ultimaps alternatives

Ultimaps Reviews
The only user review on G2, from a small-business user who pays for the Pro tier, rates it 5 out of 5, calls the software very easy to use with plenty of built-in features, and describes support as quick and helpful; G2 itself notes that one review is not enough for buying insight.
Testimonials shown on the Ultimaps homepage, which reports a 4.8 average across 72 ratings, mostly praise how easy the tool is and how well the AI feature works, but they are collected and selected by the vendor, so treat them as marketing rather than independent reviews.
Listings on SourceForge, AlternativeTo and BetaList carry no user reviews yet, and no Reddit or Hacker News discussions surfaced, so expect to judge the product on the free plan rather than on community feedback.
FAQ
Is Ultimaps free?
Yes. The free plan never expires, has no limit on maps, and includes 100 address lookups and 20 AI requests a month. You pay only for high-resolution or vector exports and maps without the credit, either per map or through Pro.
Do I need an account to use Ultimaps?
Not to start. You can make and download a map as a guest, but a free account is required to save maps, publish interactive maps and use AI requests.
What can the AI feature do?
It builds a map from a plain-language description or pasted data, can generate a dataset on request, and can read a picture of a map into an editable version. It cannot add, remove or split regions or combine two base maps, and each prompt uses one AI request.
Which AI provider processes my data?
The privacy policy lists OpenAI for AI-assisted parsing of data you paste into the map editor, alongside providers such as Cloudflare for hosting and Stripe and Lemon Squeezy for payments. Avoid pasting sensitive personal data into AI prompts.
Can I upload my own boundaries or shapefiles?
No. Ultimaps works only with its catalog of base maps. If you need a region that is not there, you can order a custom map, priced from about $57 and usually delivered in 1 to 3 business days.
Does Ultimaps stay in sync with Google Sheets?
No. Imports from Google Sheets, Notion, Excel or CSV are one-time, so you import again when the data changes. Ultimaps keeps your manual colors, tooltips and renamed legend items when you re-import.
Does Ultimaps have an API?
Yes. The Map Image API renders PNG maps from a URL with no key, a free key allows 500 renders a month, and a Pro key allows 5,000 renders with SVG output. An MCP server gives AI assistants the same rendering tools.
Can I cancel and get a refund?
You can cancel anytime from your workspace settings, and Pro stays active until the end of the paid period. Refunds cover failures on the Ultimaps side, and an unused auto-renewal can be refunded if you ask within 7 days.
Similar tools
 HexCollaborative analytics workspace that mixes SQL, Python and AI agents in notebooks, then publishes results as data apps and plain-language answers.
 WindwardMaritime AI platform that fuses AIS, satellite and ownership data into vessel risk scores, sanctions screening, alerts and container ETAs.
 Delve AIAI market research platform that builds personas from analytics, CRM and social data, then lets you chat with them or run synthetic